

Various types of cookies are used on our website (and on all other digital platforms including mobile applications). View our new THE INFORMATIVE TEXT ON LPPD AND PRIVACY here. Google Analytics Analytical cookies help us to improve our website by collecting and reporting information on its usage. Google AdWords ve Remarketing We use marketing cookies to help us improve the relevancy of advertising campaigns you receive.
I have read the above articles
This document gives information about the utilization of ZR software which enables reading values of electronic electrical counters communicating in standards of IEC62056-21, IEC870-5-102, DLMS / COSEM manually and automatically, saving, analyzing numerical and graphically, sending informative E-mails to related people, sharing the result values with ZR Cloud which is a cloud software. Z Telemetri may apply changes that are not mentioned in this document to the software without prior notice.
Please, setup the program by double clicking on Setup package just like any other Windows application and obtain a valid license.
Supported Systems: Win11, Win10, Win8.1, Win8, Win7 SP (Both 64 Bit and 32 Bit systems are supported)
Supported languages: Turkish, English, Spanish and Polish, any other language on demand.

Once the program is installed, you may start the program by double clicking on ZR icon shown in picture below.
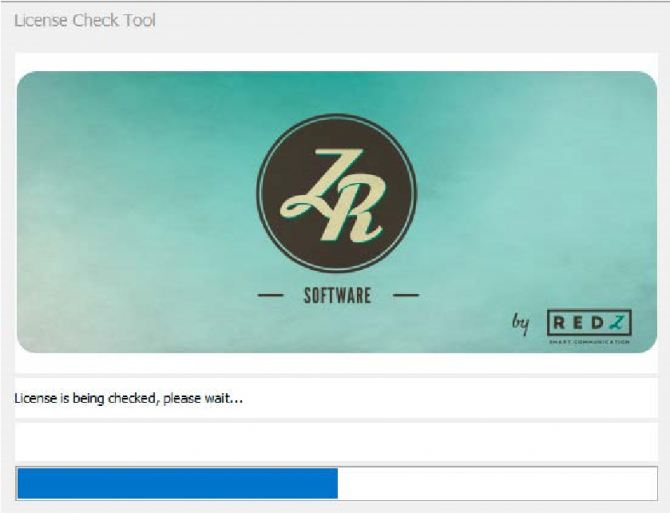
As soon as the program starts, the license information will be checked as in picture below. Then the program will be started. Please wait the main screen of ZR software to open.
Your license type might be one of the following;
There may be one or more modules can be found mentioned below according to your license type as well;
The features that are independent from license
ZR software, has been developed in a modular structure that consists of ribbon pages and advantages of this structure are as follows:
Every module has its own special functionality. You may own one or more than one modules according to your license restrictions.
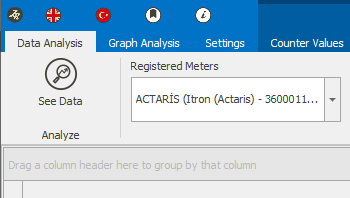
The basic module of ZR software is Settings module. It is independent from your license type and it is available in the software with all license types. The properties of menu options are described in picture below.

After the determination of the preferred language please change the language by pressing to the relevant button. Software language will change immediately for all software and modules. Available languages are as follows;

NOTE: Please contact to our company for the integration of other languages to the software.

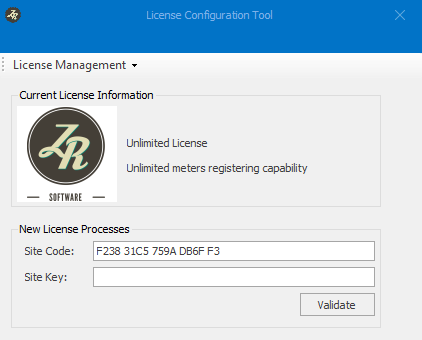
Please, press License button in order to open License Configuration Tool. Screen in picture below will appear.
Please contact our company to buy a valid license by the “Site Code” information that appears on this screen and press “Confirm” button by entering the “Site Key” information sent to you. Your program will be registered then.
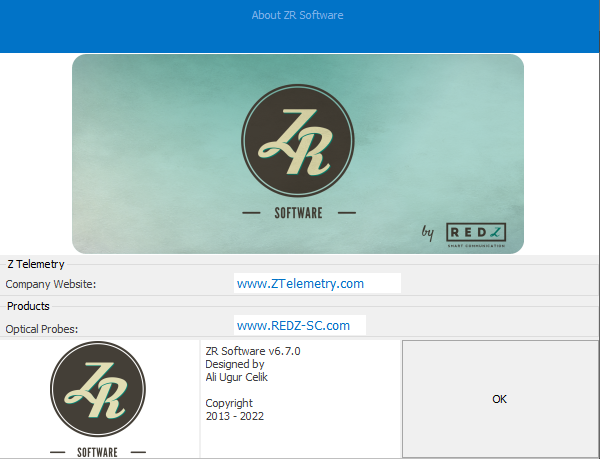
Please click on “About” button in order to get the software version information and Z Telemetri company contact information. You may click on the link shown in picture below to access to the related website.
It is possible to send special reports to relevant mail addresses. You should specify the Mail Server, User Name, Password, Server Port, Mail Subject and Mail Adress which you can see in picture below. Then you should also specify the period of reporting. Finally when you click Activate Mail Sending button the counter data read will be sent to the related person. For Monthly selection, every month at 12:07, the monthly report is sent. For Hourly selection, values for that day are reported at each 10 minutes. Both selections can be active at the same time.

This software is designed to run as Server or Client. Depending on the type of license, the software can only be Server or Client. The server software is no different from standard ZR Software. In case of client software, the reading functions are restricted and the data can only be extracted and analyzed from the server ZR Software. It has been developed for the use of a location which has more than one type of ZR Software.
In the server software, the Server Listening Port specified in picture below must be specified. The number of ZR Client which the server will connect, must be specified and then you should click the Server Start. The corresponding port must be accessible via the network (the relevant firewall settings must be made if necessary). After the correct operation the button will remain pressed.

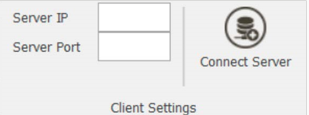
The software has been developed to operate as both Server and Client. In client ZR Software, the reading functions are restricted and the data can only be extracted and analyzed from the server ZR Software. It has been developed for the use of more than one type of ZR Software at the same location. For the client software in picture below, the Server IP of the ZR software running as the Server should be specified in, the Server Port must be entered, and you should click to the Connect Server key. The corresponding port must be accessible via the network (the relevant firewall settings must be established if necessary). After the correct operation, the button will be pressed and the registered meters will be listed. The client software only works with Data analysis options. All other settings are checked from the server software. Example menu options are shown in picture below


In order to read faster and easier more than one EMH, Elster, Itron (previously known as Actaris) Landis&Gyr, Iskra, Pozyton, Socomec, Köhler, Makel, counter that supports IEC870-5-102 protocol or other (mentioned as NONE) counter registry is made by entering counter information and communication type. Registry process also has to be executed for load profile reading process. Saved counters are displayed in all communication types. Necessary procedures in order to execute counter registry are described in picture below.
At Communication Type group communication type that will be registered is selected. According to the selected communication type SERIAL, ETH and GSM setting can be changed.
The relevant settings, must be entered as it is described in SERIAL, ETH and GPRS Communication Modules. In picture below, one of the exemplary preference is shown.
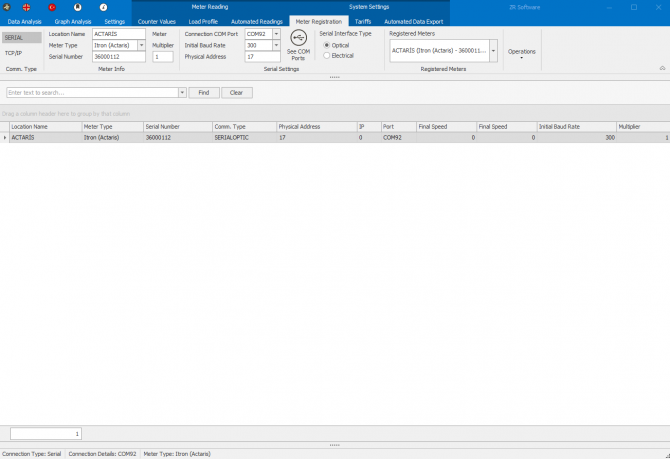
Location Name: Denotation that states the location of the counter
Serial number: Serial number of the counter. If it is shorter than 8 digits, it is recommended to be completed by adding «0» (zeros) at the beginning.

Counter Type:
Or if it any other of than these can be selected as None. None option can be used if the counter is none of the types mentioned above. If selected None, communication is realized through IEC62056-21 Mode C protocol.
Counter Factor: This option is only used at the multiplication of counter profile values with an external factor during the registry. It is not essential for serial communication module. This value cannot be left blank and if there is no factor it must be entered as 1. When the selected counter changes in the list of registered counters the information of recently selected counter is filled automatically at the fields shown in picture below. When the location name, serial number, counter type and factor values are desired to be changed, after selecting the relevant counter from the registered counters then the modifications can be applied by updating at these fields under the Operations group. There will be no changes at the system for the new entries or alterations on existing counter information unless saving to the system by the utilization of buttons at the Operations group. These fields must not be left blank in the course of registering and saving the counter.

NOTE: All of the index values that operates at the standard of IEC62056-21 can be read by using ZR software. Yet load profile reading module operates for (if you have in your license) EMH, Elster, Landis & Gyr, ITRON (Actaris), Iskra counters that support IEC870-5-102 protocol, Köhler and Makel counters. Within this scope selection of counter type is essential for Load Profile Module.
Settings Group − SERIAL
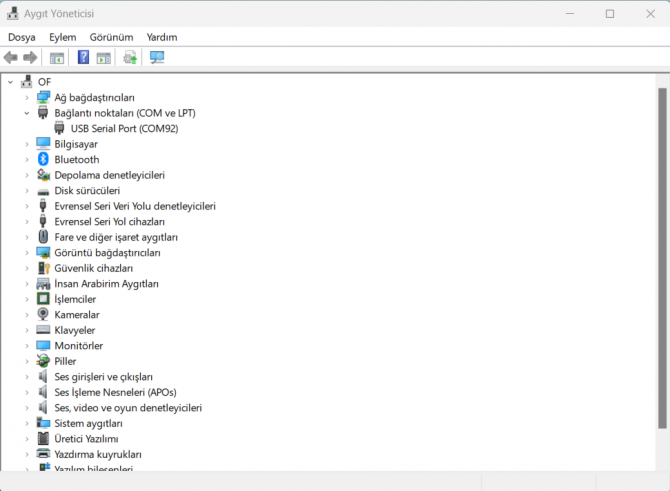
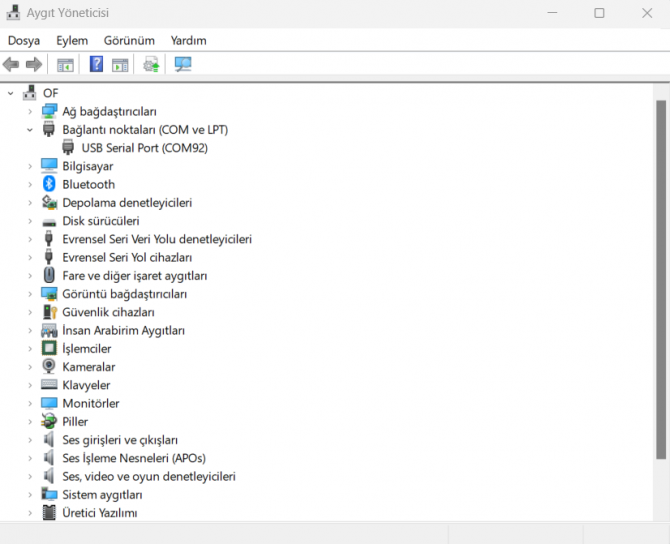
Setting group can change according to the selected communication type. When serial communication type is selected it is shown in picture below.

In order to communicate with counter, there are some simple settings must be made in the software.
Settings Group - ETH and GPRS
Setting group changes according to the chosen communication type. When TCP/IP communication type is selected it is shown in picture below.,

In order to execute communication with counter, there are some simple settings must be made in the software.

NOTE: Please make sure that the connection to the communication device and remote port is executed correctly. If you have any hesitations about checking the connection with the remote port is executed correctly, please ask help from your network administrator.
Settings Group - GSM
The settings group changes with the selection of communication type. You can see the case of GSM communication type selected, from the in picture below.

In order to communicate with counter, few simple adjustments have to be made in the software.
It is sufficient to press Read button after selecting the desired meter listed under Registered Counters in order to make easy readings in the system. Yet in order to save read counter to the system and to read quickly without entering the parameters of this counter in the future again, user need to add it to Registered Counters as it is shown in picture below. In this group registered counters to the system are displayed. Within this list all the counters which use different communication infrastructures are displayed together. When a new counter is selected from the list, the relevant communication infrastructure type will be selected and the relevant parameters will be filled automatically.

The location name, counter type, serial number of the counter and the registered id number of the counter in the registered counters list is displayed in the following format. The important thing for the user here is the location of the counter, type of counter and its serial number.
Location name (Counter Type – Serial Number) (Counter Id)
A new counter can be added, the information of the available registered counter can be edited or another available registered counter can be deleted from the registered counter list by using the Operations menu group. For details please apply to Operations Group descriptions.

At the bottom of the window, all the registered counters are listed. An example is shown in picture below. It is possible to select meter briefly at the top by double clicking the
corresponding number. It is also possible to quickly search by entering the information (counter serial number, location name, etc.) of any recording into the corresponding box.
In Operations Group, Add, Edit and Delete processes are available. ZR software enables saving and recalling the counter information in the system. This way previously identified counters are listed in the Registered Counters group every time ZR is opened. Index reading or load profile reading processes can be executed by choosing these counters. In the processes group a new counter can be added by using Add button. In the Settings and Counter Information group entered counter information is saved to the system. In the same way, when it is wanted to change counter information, counter information can be updated by using the latest information that has been entered to Settings and Counter Information group by clicking on Edit button. In order to delete a registered counter from the system it is needed to click on Delete button. These buttons are shown in picture below. In order to prevent executing on the counter by mistake, the confirmation of the user is obtained before the process has been completed “Are you sure to save a new counter?”, “Are you sure to change the selected counter?” or “Are you sure to delete the selected counter?” questions are asked by the system.

Before adding new counter and editing counter processes a check is executed by the system whether the necessary data is entered or not. For instance, If Location Name wasn’t entered, user is warned by “Please enter Counter Location!”. The required fields in the new counter entry and edit counter for serial communication are as follows: Communication Information, Location Name, Serial Number, Counter Type and Counter Multiplier.
You can communicate with all counters which use IEC62056-21 (previously known IEC1107) Mode-C and IEC870-5-102 standards without brand or type restriction. Also you can read index values with DLMS/COSEM protocol with Landis & Gyr and Itron (former name Actaris) brand counters if you have the relevant license. For Socomec counters, you can communicate with Modbus protocol. The billing values for the read counters are stored in the database as a single row. This value is usually the first day of the month recorded by the meter which is recorded at 00:00. This value will be recorded if it is performed manually with the button on the counter. The date and time of all values are read from the counter.User can communicate with the following communication methods over Serial, TCP/IP and GSM;. Menu preferences are described in picture below.
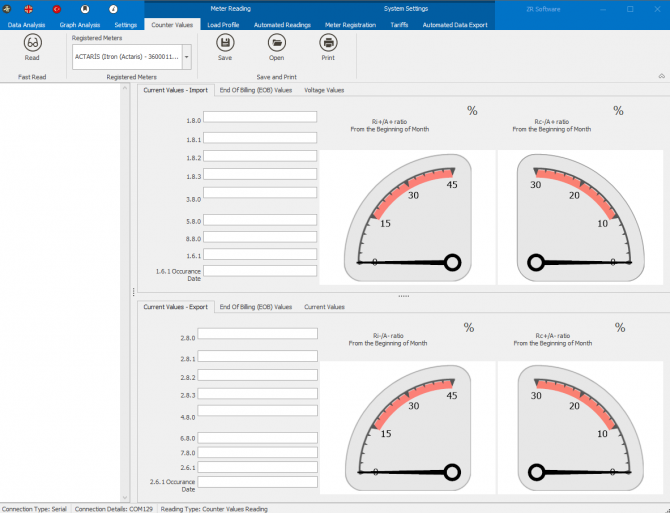
Fast Read group enables the execution of communication with the counters. Menu preferences are presented in picture below.

Please click on Read Button to start reading after executing the settings. The program, will start the counter communication with the mentioned settings and will display instant reading status in Communication Status section.Sample reading is presented in picture below.
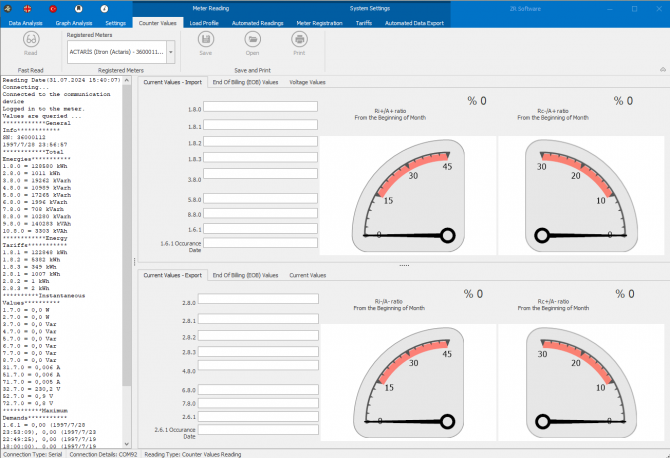
In case of an error during reading, detailed information will be presented in the instant communication section concerning the error. In this situation, try reading the counter once again by changing reading options within the scope of details listed in instant communication status.
In the event of reading the counter successfully, the Device has been read successfully and BCC correct statements will take place in the instant communication status section and this section will turn into green. In case of an error during reading, again the error will be notified in the same section and this section will turn into red. The screenshot sample after the correct reading is represented in picture below.
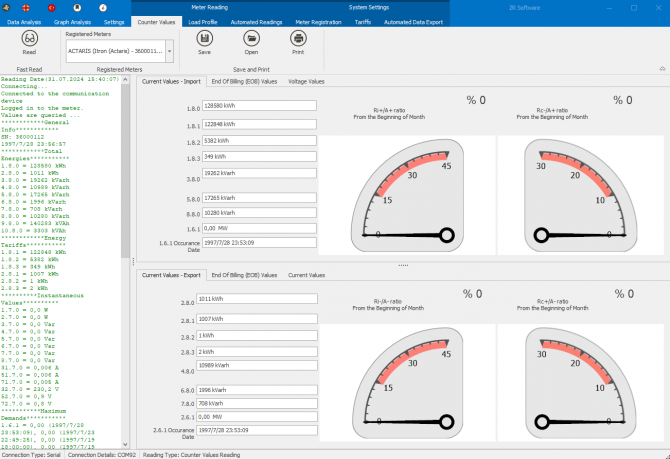
In the event of a successful reading, data will be displayed in Data Analyze section in a more legible and graphical formatting after being analyzed. In Current Values section, in addition to existing billing values and voltage ratings reactive/active energy ratios that has been composed from the latest billing period will be displayed in import and export directions as shown in pictue below.
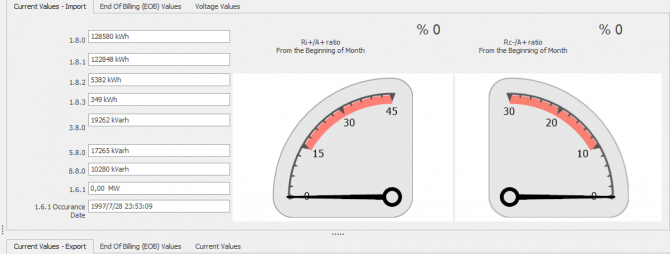
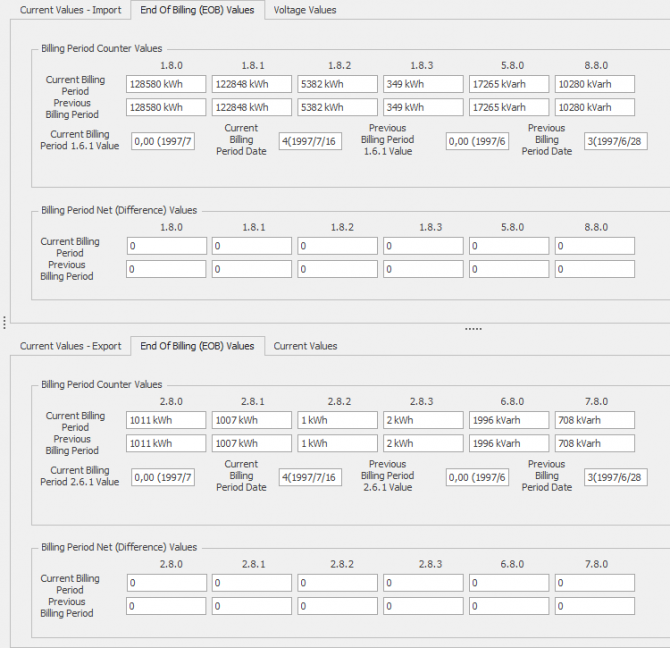
In End of Billing Values section the latest and the previous Billing values are displayed in import and export directions and by this means the latest and the previous billing periods values are available as it is shown in picture below.
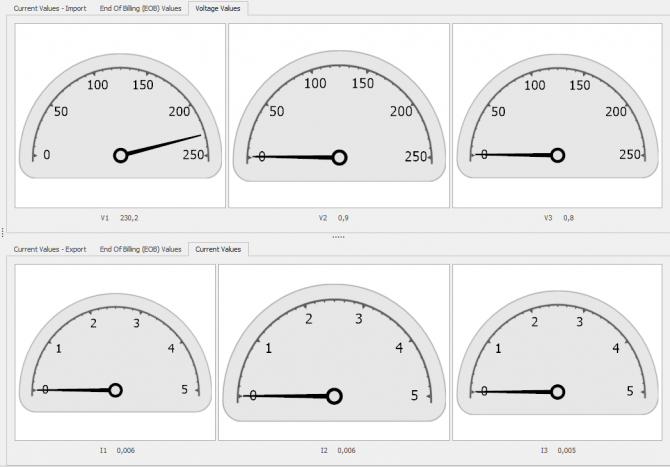
In Voltage and Current Values section values are displayed for all phases as it is shown in picture below. These values can be displayed in all counters that which supports communication.
You can also check those important settings from Information Bar and change them according to your needs. A sample of information Bar is shown in picture below.
![]()
It is sufficient to press Read button after selecting the desired meter listed under Registered Counters in order to make easy readings in the system. Yet in order to save read counter to the system and to read quickly without entering the parameters of this counter in the future again,user need to add it to Registered Counters as it is shown in below picture. In this group registered counters to the system are displayed. Within this list all the counters which use different communication infrastructures are displayed together. When a new counter is selected from the list, the relevant communication infrastructure type will be selected and the relevant parameters will be filled automatically.

The location name, counter type, serial number of the counter and the registered id number of the counter in the registered counters list is displayed in the following format. The important thing for the user here is the location of the counter, type of counter and its serial number.
Location name (Counter Type – Serial Number) (Counter Id)
A new counter can be added, the information of the available registered counter can be edited or another available registered counter can be deleted from the registered counter list by using the Operations menu group. For details please apply to Operations Group descriptions.
Through the buttons of Save and Print group, it is possible to save the read data, to reopen the saved data and to print it. By this means archival storage and utilization of the read data in different time frames are possible. Menu options are presented in picture below.

Once the counter is read correctly Save button must be clicked on so as to save the read data. Saving dialogue window will be opened as shown in picture below.
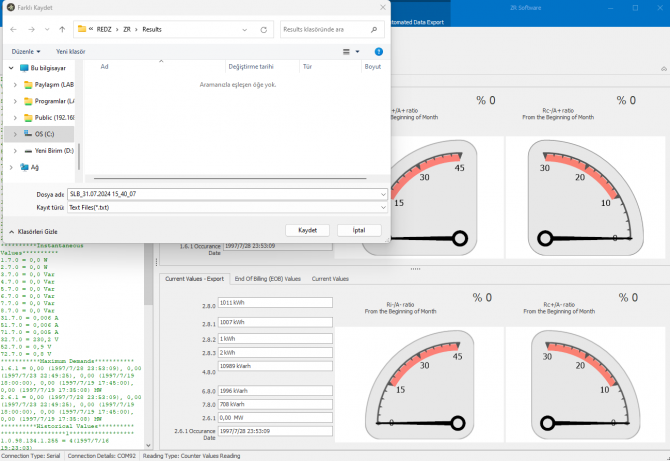
Default path of the saved file: The folder that the program installed \Results
Default name of the saved file: in the format of (if available) IEC code - reading date - reading time.
Once the name of the file is determined Save button must be clicked on so as to execute saving process.
If the previously saved file is needed to be viewed by reopening it Open button must be clicked. Open file dialogue window will be opened as shown in pictue below.
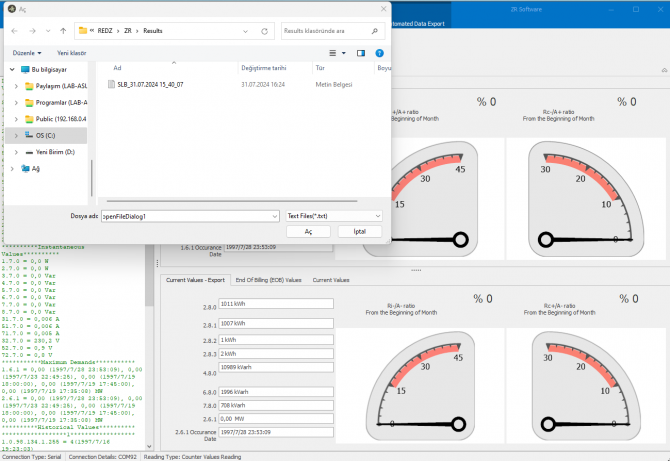

NOTE: It is possible to save any data shown at instant communication status including the errors occur during communication. Therefore, Data Analyze section will not be updated once a new file is opened.
Print button must be clicked on so as to create reports from previously read or recently read data. Report Creation Options shown in picture below will be displayed.
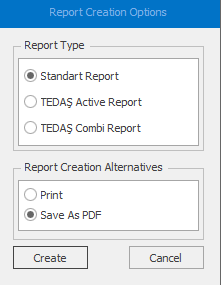
Initially please choose the report type, then click on Create button after choosing report creation alternative. Available versions are as follows;
Report Types:
Report Creation Versions:

NOTE: Please contact our company for your special reporting needs.
Screen shots related to available reporting are presented below as an example.
Standard Report: Is a report that index values are displayed as a result of reading. Standard report sample can be seen in picture below.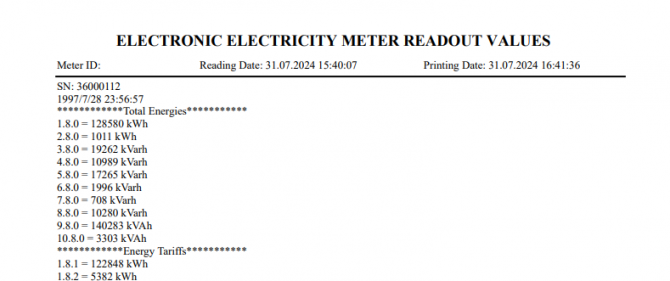
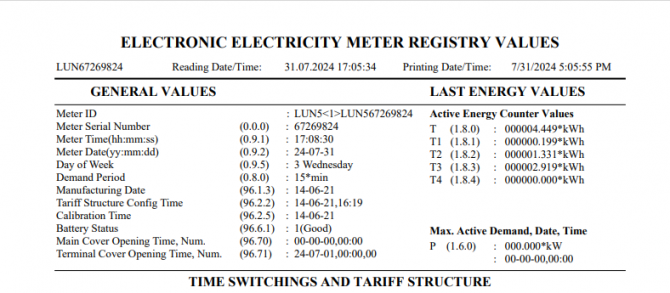
Tedas Active Report: Is a report of the counters which execute Active Energy measurement in details. Tedas Active Report sample can be seen in picture below.
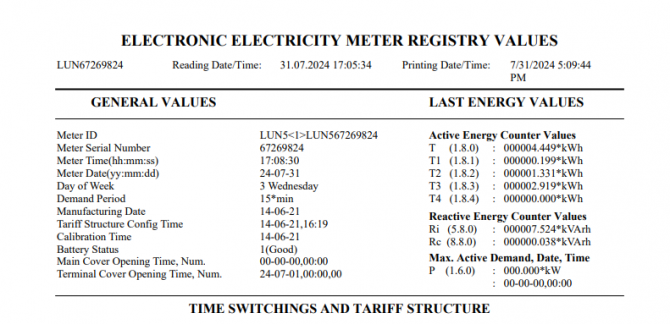
Tedas Combi Report: Is a report of the counters which execute Active and Reactive Energy measurement in details. Tedas Combi Report sample can be seen in picture below.
For the tariffs you want to save under the Targets module; You create the tariff by entering the tariff name, tariff start time and tariff end time information and clicking the Add button. You can then analyze the data from Data Analysis Module by selecting this tariff you created. In picture below shows the example of the tariff.
The tariff-based report example in data analysis is shown in picture below. The values in the specified range are also reported according to the tariff structure created. The hours are grouped according to the tariff name.

By ZR software, EMH, Elster, Itron (former name Actaris), Landis&Gyr, Iskra, Pozyton, all counters that communicates in IEC870-5-102 standards, Köhler and Makel counters load profile values can be read by the utilization of communication infrastructures of the Serial Communication, ETH and GPRS communication modules. The read load profile values are saved within the system. They are reported in different ways based on user selections.

NOTE: Please contact our company for the integration of different brand of counters to the system as well.
Please use Load Profile Module to read load profiles of meters. The features of the menu options are described in picture below.
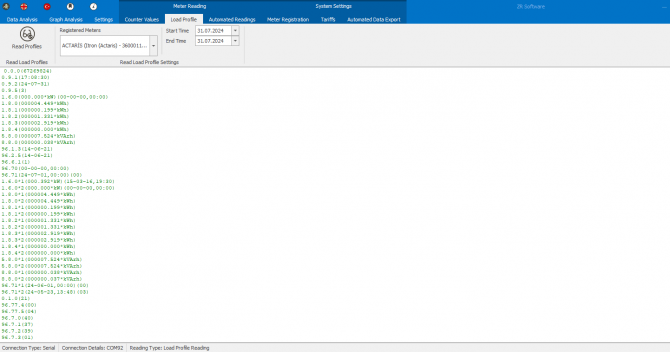
Read Load Profiles Group lets user to read load profile from counters. Reading process is started by clicking on Read Profiles button. Menu options are presented in picture below.

NOTE: It is only possible to read Load Profile values of the registered counters of EMH, Elster, Itron (former name Actaris), Landis&Gyr, Iskra, Pozyton, Köhler, Makel and IEC870-5-102 standard counters. Please contact our company for the integration of different brand counters to the system as well.

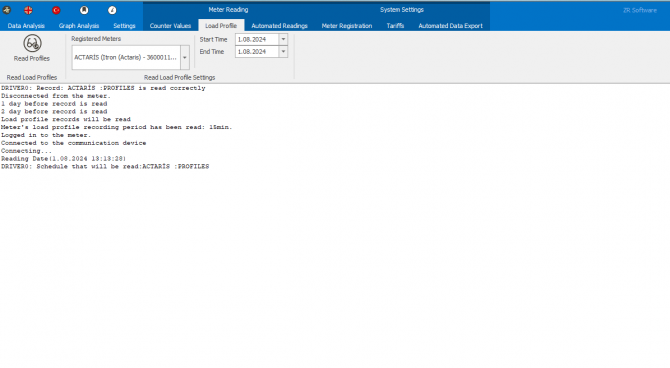
During the load profile reading instant reading status will be displayed in Communication Status section shown in picture below. In case of an error during reading, detailed information about the error will be presented in the instant communication section.
In the event of reading the counter successfully, “Registered meter is read correctly” statement will take place in the instant communication section. In the event of an error during reading, the error will be notified in the same section and “Registered meter couldn’t be read despite the retries mentioned” statement will take place.
All the registered counters to the system are displayed in Registered Counters list. Within this list all the counters which use different communication infrastructures are always displayed together. Reading interval is determined by choosing the start and end dates. Start date must be 12 months before from end date at most. This process is valid for counters of EMH, Elster, Itron (former name Actaris), Landis&Gyr, Iskra, Pozyton, IEC870-5-102 standards and Makel. Load reading profile settings are seen in picture below.

Köhler brand counter doesn’t permit reading within the date range. Therefore reading must be executed by entering the number of registers to read. In picute below reading settings for Köhler brand counter can be seen.

In Köhler brand counters, how many registers from past (each register corresponds to 30 minutes of data, in order to read one day register at least 48 registers must be read), in EMH, Elster, Itron (former name Actaris), Landis&Gyr, Iskra, Pozyton, counters communicate with standards of IEC870-5-102 and Makel counters how many days from past will be read must be determined.
Auto Read Load Profile List is the section where user creates a circular load profile reading list in the system by selecting necessary reading period information for the counters registered in system.For automatic meter reading, enter the registered counters’, Data Type and reading period(month, day, hour, minute) like in picture below. Then select the Driver to read. This can be done for multiple counters at the same time.Any of the counters registered in the system can be selected in the Registered Meters section. There should be sure that the counter values can be read on this meter. In the Data Type section, choose whether to read Load profile or billing values. Load profile reading will be done when load profiles are selected. Reading the billing values will be performed when the billing value is selected. This value is usually 00:00 at the beginning of the month (if the billing is not done via the counter manually).
The month, day, hour and minute selection specifies the period. For instance:

In the Driver section, the driver to read meter is selected. There are 5 different drivers in the system. Counters connected to the same communication channel (for instance connected to the same serial cable or connected to the same mode) must be read via the same driver. You can use the Operations section shown in picture below for adding and deleting lines / counters.

After you press Save button, the addition, subtraction, editing operations to the reading list are activated. To start automatic reading, press the Start button. The same key can be used to terminate reading. System remembers your last preference, and the program is designed to continue from where you left off even when you restart it. Also the number of unsuccessful attempts after reading is automatically adjusted according to the reading period.
Load profile values read through Load Profile Reading module, are saved in the system database with meter’s own period. Load profile values can be displayed through Data analyze module, values can be exported to Excel or OSF form can be created for the values. The values that will be displayed can be chosen from registered counters, created formulas or created custom reports. This menu options are presented in picture below.
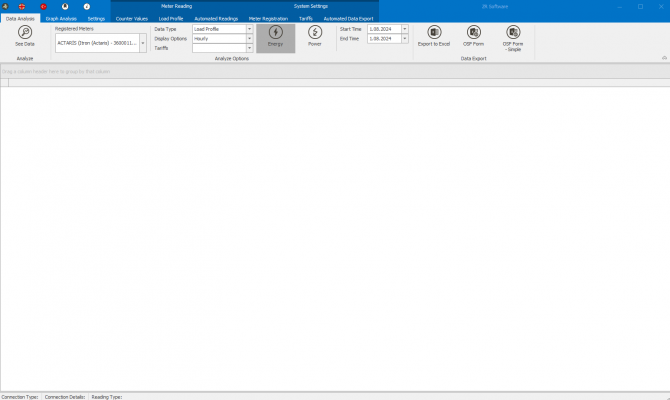
Analyze group, provides the process of analyzing load profile data that is read from counters and listing in detail. Analyzing process is initiated by clicking on See Data after the counter is selected. Menu options are presented in picture below.

In Registered Counters list all counters registered to the system are displayed. Within this list all the counters which use different communication infrastructures are displayed together. Also the previously defined formulas and custom reports are listed in this place.

In the Data Type section, choose the data to be analyzed whether as Load Profile or Billing Value. Billing values usually start at the beginning of the month, you should make sure that there is also a record value in the date selection.In the Start/End Dates and display options (Detailed, 15 Minutes, 30 Minutes, Hourly and Daily), the time range and reading period of the data are determined. The detailed data represent the display of the counter according to the default period and also showing all the values read. The information stored in the load profile can also be viewed. If a predefined tariff is available in the schedules, it can also be selected. Values on this page will be grouped by tariff. Some counter values in load profiles, some of them store energy, and some store power values. ZR software tries to read all these values and keeps them in the database. Depending on whether your meter’s stored data is Energy or Power value, the relevant selection must be made. After all selections, the data is listed by pressing the See Data button. In picture below shows the See Data settings.
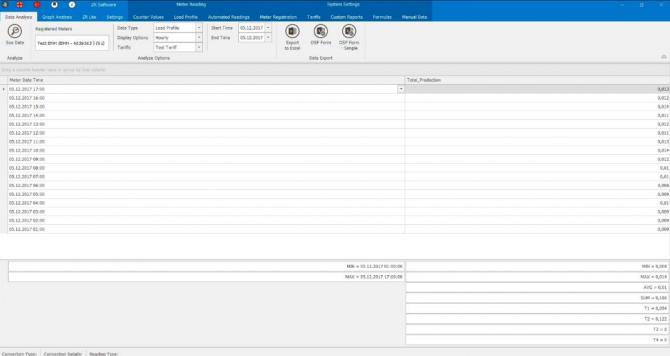
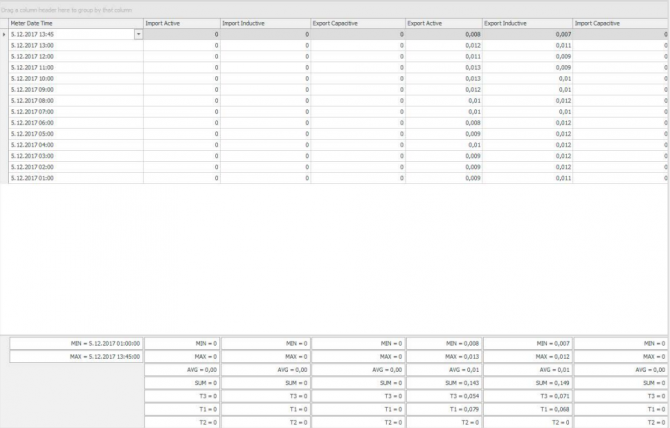
If the analyze results are desired to be displayed in details, the counter that will be analyzed is chosen and after selecting Detailed option from the Display Options See Data button is clicked. The data will be displayed in details as it is shown in picture below. The time range and detail of this data may vary according to the counter type.
Minimum (MIN, maximum (MAX) average (AVG) and total values (SUM) of the data analyze period are displayed at the bottom of the columns automatically.
Load profile analyze result can be saved in MS Excel file format or OSF Form format. Menu options are presented in picture below.

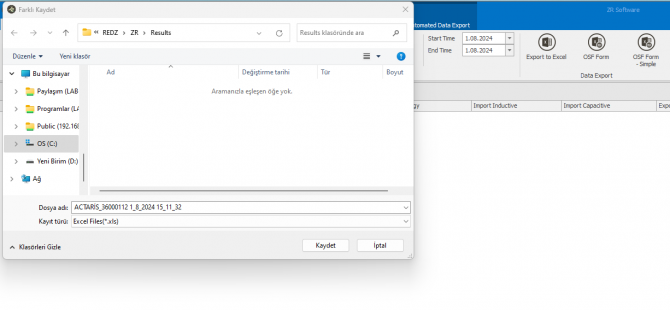
Export to Excel button is clicked in order to save data analyze converted to Excel format. File is saved as excel file (file with extension xls) in the opened window. Sample screenshot is presented in picture below.
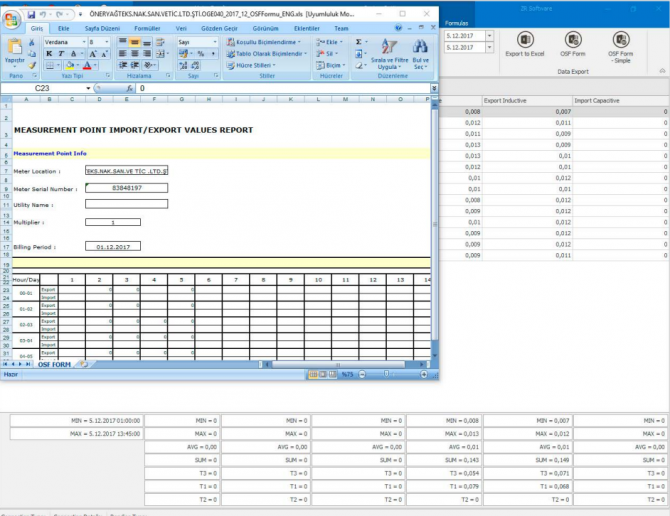
To convert load profile analyze results to OSF form it is enough to click on the OSF form button after choosing the relevant month. Sample screenshot is presented in picture below.

NOTE: The beginning and the end date of selection is must be in the month that the reported needed to be created. OSF report of the entire month will be exported.
This module is used for creating graphics from registered counters whose load profile is read, from the created formulas or created Custom reports. The necessary procedures to create a graphic is explained in picture below.
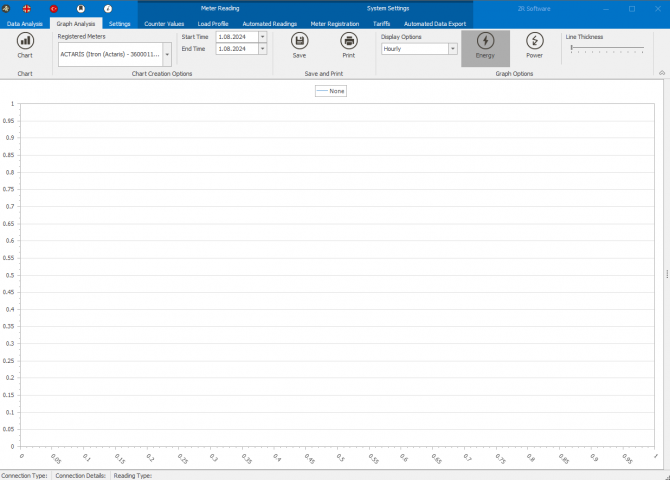
After selecting the counter, created formula or created custom report from the registered counters list, time frame that the values will be analyzed must be selected. After this process graphic type must be chosen from 15 minutes, 30 minutes, hourly, daily or Detailed from Display Options. Detailed data is shown at counter period (generally 15 minute intervals are available at the counters). Hourly data is consisted of summing up those values hourly. Daily data is consisted of summing up those values daily as well. After those settings, Chart button can be clicked. Sample Graphic is shown in picture below.
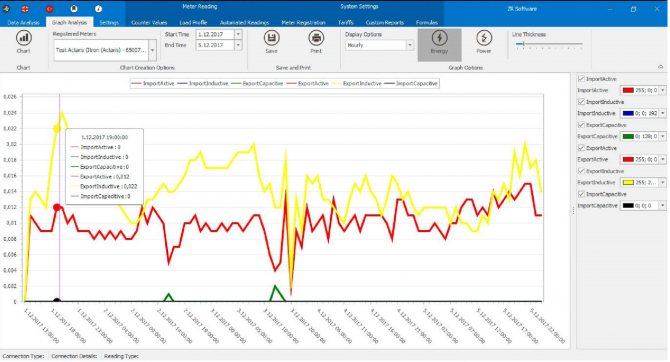
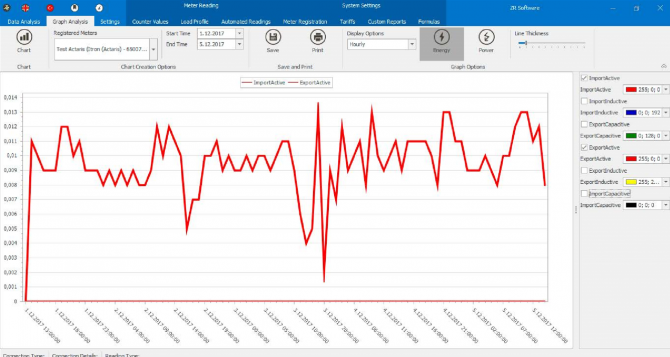
It is possible to remove or add again one or a few of the displayed values off the display with the help of the menu which is located at the right side of the screen. Ticking the boxes that are next to the counter parameters is sufficient to do so. It is shown in picture below.
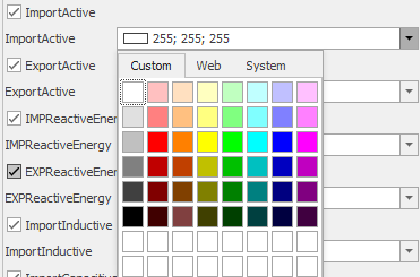
In addition to this it is possible to change the color of the graphic lines with the help of the menu. As color options different colors can be assigned for each counter parameter such as Custom, Web and System. It is shown in picture below.

The thickness of the graphic lines created can be adjusted by Line Thickness section in the Graphic Preferences menu. It is shown in picture below.
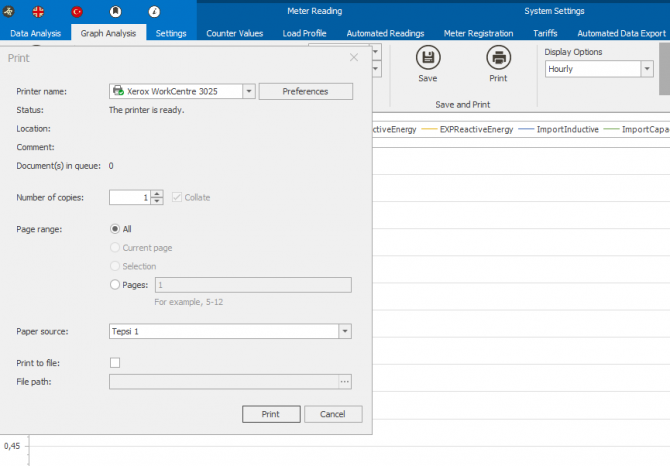
Graphic analyze results can be saved as PDF format and can be printed same way. Menu options are shown in picture below.

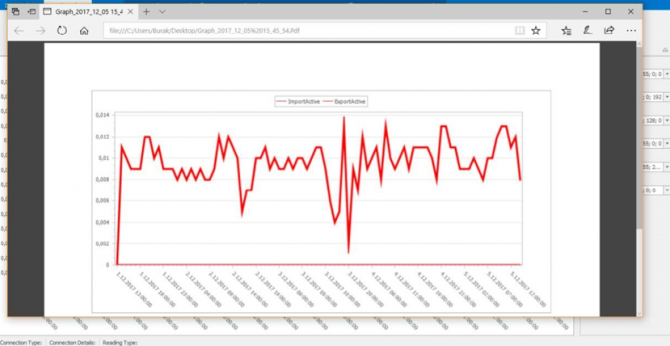
In order to save Graphic analyze result by converting into PDF format Save button should be clicked. File is saved in the opened window as pdf file (pdf extension file). Sample screenshot is shown in picture below.
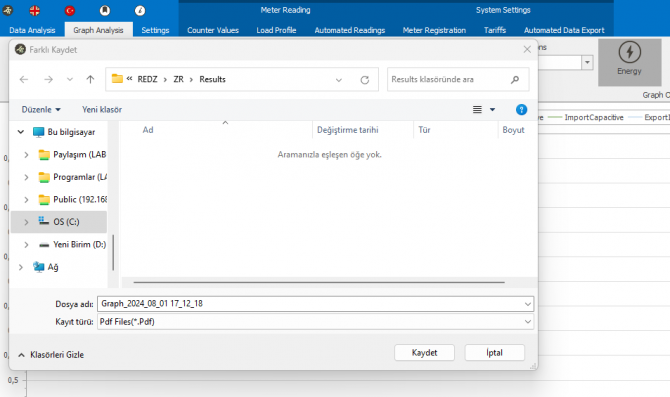
Graphic sample created in PDF format is presented in picture below.
In order to save previously created or recently created graphic as a report, Print button should be clicked on. It is shown in picture below.
Custom Reports Module lets user to create custom reports based on registered counters whose load profile is read or the formulas created. Thus user can analyze any data at the measuring point in a report that is created after delivery of ZR Software by user. Different measuring points can be analyzed at the same report and also virtual data created at the formula section can be attached to the same report. Necessary procedures to create a special report, is explained in picture below.
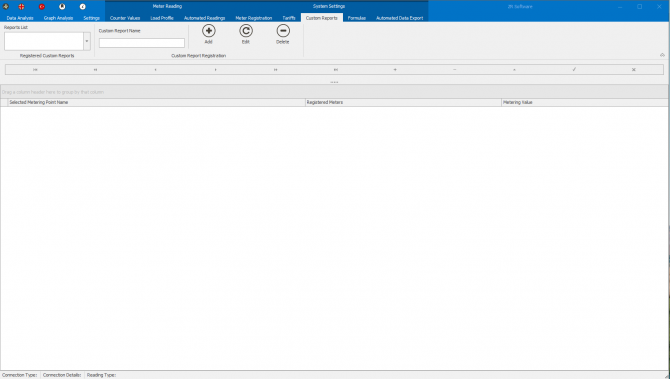
In order to create Custom Report, first of all the name of the report is entered as shown in picture below. After setting the name of Custom Report a new row can be added from the operations menu by clicking on “+” button and by clicking on “-” button existing row can be deleted. It is shown in picture below.


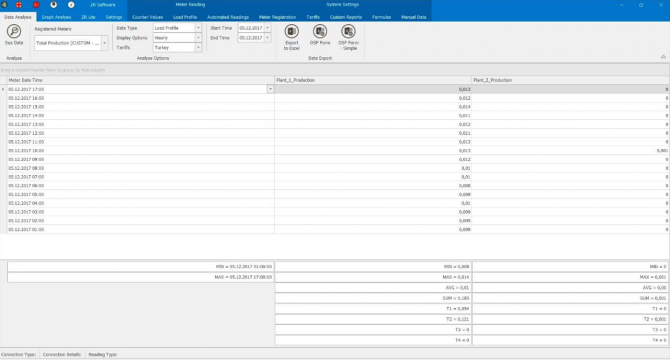
Selected Measuring Point name is entered to the new added row. This value is used for the column heading of the reporting. Counter is chosen at the registered counters and Metering Value relevant to the registered counter is entered. This process is repeated for each new added counter row, an example Custom Report is displayed in picture below. By clicking on Add button the new Custom Report will be added. To apply the changes made at the current report Edit and to delete the report Delete button can be used.

Both data analyze and graphic analyze of the created Custom Report can be executed. As it is shown in picture below it is possible to analyze the Custom Report in between selected dates from the Data Analyze Module.All the display options of the Data Analyze and Exporting to Excel is available for Custom Report, too.
In a similar way as it is shown in picture below it is possible to analyze the Custom Report in between selected dates from the Graphic Analyze Module. Each measuring point specified at the graphic is represented by a different color.
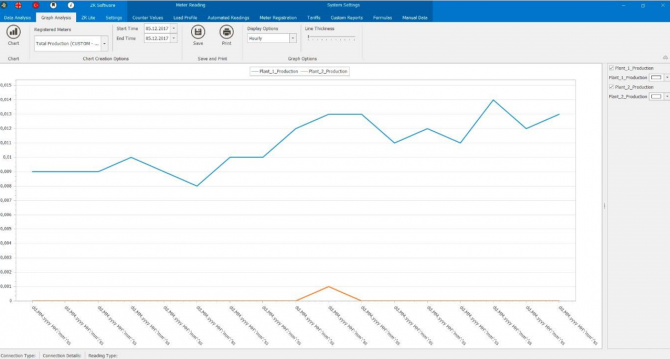
All the display options at the graphic analyze are also available for Custom Reports such as Line Thickness, colors of the series in graphic, Saving and Printing processes.
It is used to create special formulas from the registered counters whose load profile is read. A special formula is created by values read from the counters (Export Active, Import Active, Export Inductive, Import Inductive, Export Capacitive, Import Capacitive) and it is made possible to analyze them as user needed. It is explained in detail in picture below.
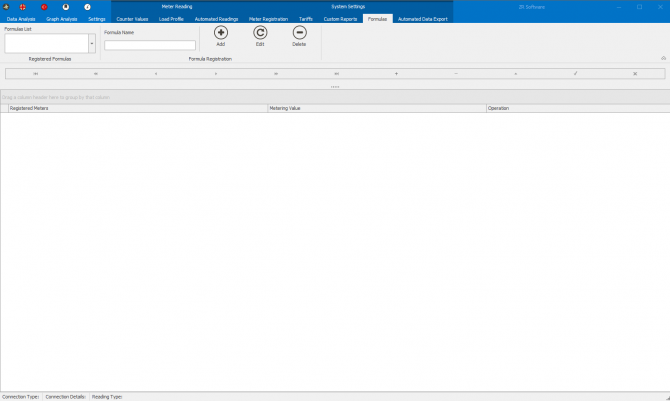
In order to create a new formula, the name of the formula must be entered as it is shown in picture below. After setting the name of Formula a new row can be added from the operations menu by clicking on “+” button and by clicking on “−” button existing row can be deleted. It is shown in picture below.


At the new added row one of the registered counters is selected, Counter Measurement Value relevant to the registered counter is picked and after then within the formula “+” (sum up) or “−” (subtract) transaction is chosen according to the user formula need. This process is repeated for each row added. A sample formula is shown in picture below. A new formula will be added by clicking on Add button. Changes realizes at the existing formula can be saved by Edit button. Delete button is used for deleting existing formula.Both data analyze and graphic analyze of the created Formula can be executed. As it is shown in picture below it is possible to analyze the Formula in between selected dates from the Data Analyze Module. All the display options of the Data Analyze and Exporting to Excel is available for Formulas, too.

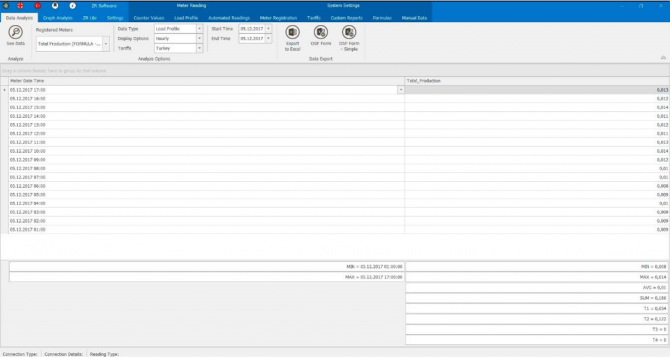
In a similar way as it is shown in picture below it is possible to analyze the Formula in between selected dates from the Graphic Analyze Module.
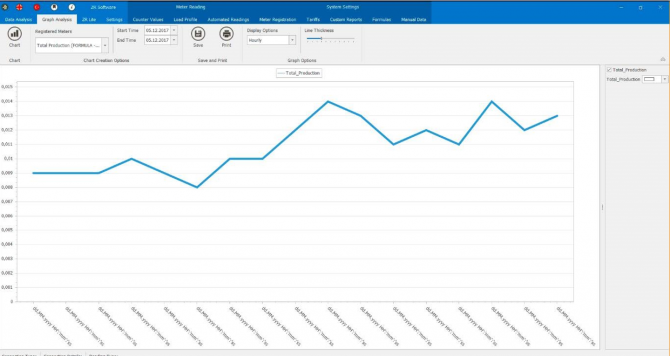
All the display options at the graphic analyze are also available for Formulas such as Line Thickness, colors of the series in graphic, Saving and Printing processes.
Here is a video example on how to register a meter on ZR Software, read its counter values and save read data.